import matplotlib
import matplotlib.pyplot as plt
import re
import json
import random
from collections import Counter
from datetime import datetime
import tkinter as tk
from tkinter import filedialog, messagebox, ttk
# 优化字体配置,使用 Windows 系统更通用的字体
plt.rcParams["font.family"] = ["SimHei", "Microsoft YaHei", "SimSun", "Arial"]
# 设置字体查找的回退机制
plt.rcParams["axes.unicode_minus"] = False # 解决负号显示问题
matplotlib.use('Agg') # 使用非交互式后端
class ApacheLogAnalyzer:
def __init__(self, log_file_path=None):
self.log_file_path = log_file_path
self.logs = []
self.parsed_logs = []
self.hourly_traffic = None
self.ip_counts = None
self.status_code_counts = None
self.request_method_counts = None
self.most_requested_paths = None
self.analysis_report = "" # 存储文字分析报告
def load_logs(self):
try:
with open(self.log_file_path, 'r', encoding='utf-8') as file:
self.logs = file.readlines()
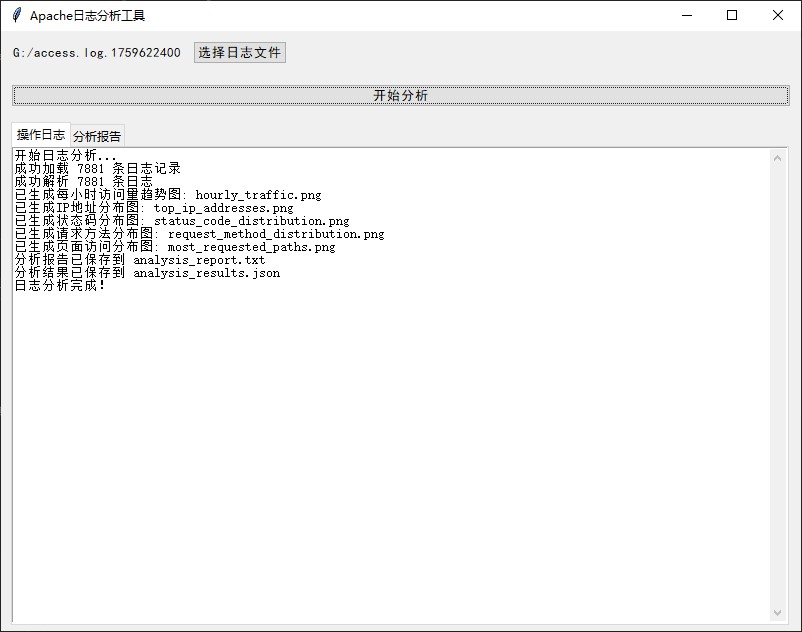
print(f"成功加载 {len(self.logs)} 条日志记录")
return True
except Exception as e:
print(f"加载日志文件失败: {str(e)}")
# 加载失败时使用模拟数据
self._generate_sample_logs()
return False
def _generate_sample_logs(self):
"""当无法加载实际日志时,生成模拟日志数据"""
print("正在生成模拟日志数据...")
sample_logs = []
sample_ips = ["192.168.1.1", "10.0.0.1", "172.16.0.1", "192.168.0.1", "10.10.10.1"]
sample_paths = ["/index.html", "/about.html", "/contact.html", "/products.html", "/blog/post1.html"]
sample_methods = ["GET", "POST", "PUT", "DELETE"]
sample_status = [200, 404, 500, 301, 403]
# 生成24小时的模拟数据
for hour in range(24):
# 每个小时生成随机数量的请求
requests_count = random.randint(10, 50)
for _ in range(requests_count):
ip = random.choice(sample_ips)
method = random.choice(sample_methods)
path = random.choice(sample_paths)
status = random.choice(sample_status)
size = random.randint(100, 5000)
# 构建模拟日志行
log_line = f"{ip} - - [{hour}:{random.randint(0,59)}:{random.randint(0,59)} +0000] "
log_line += f'"{method} {path} HTTP/1.1" {status} {size}'
sample_logs.append(log_line)
self.logs = sample_logs
print(f"生成了 {len(self.logs)} 条模拟日志")
def parse_logs(self):
# 优化的正则表达式,处理各种可能的日志格式
log_pattern = re.compile(r'(\S+) - - \[(.*?)\] "(.*?)" (\d+) (\S+)')
self.parsed_logs = []
for log in self.logs:
match = log_pattern.match(log)
if match:
ip, timestamp_str, request, status_code, response_size = match.groups()
# 解析请求方法和路径
request_parts = request.split()
if len(request_parts) >= 2:
method = request_parts[0]
path = request_parts[1]
else:
method = "UNKNOWN"
path = request
# 解析时间戳
try:
# 处理常见的Apache日志时间格式
timestamp = datetime.strptime(timestamp_str.split()[0], '%d/%b/%Y:%H:%M:%S')
hour = f"{timestamp.hour:02d}:00"
except:
hour = "unknown"
# 处理响应大小
try:
response_size = int(response_size) if response_size != '-' else 0
except:
response_size = 0
self.parsed_logs.append({
'ip': ip,
'timestamp': timestamp_str,
'hour': hour,
'request': request,
'method': method,
'path': path,
'status_code': int(status_code),
'response_size': response_size
})
print(f"成功解析 {len(self.parsed_logs)} 条日志")
return len(self.parsed_logs) > 0
def analyze_traffic_by_hour(self):
hourly_traffic = Counter()
# 确保有0-23时的所有数据点,即使没有访问
for hour in range(24):
hourly_traffic[f"{hour:02d}:00"] = 0
for log in self.parsed_logs:
if log['hour'] != "unknown":
hourly_traffic[log['hour']] += 1
self.hourly_traffic = hourly_traffic
return hourly_traffic
def analyze_ip_addresses(self, top_n=10):
ip_counter = Counter(log['ip'] for log in self.parsed_logs)
self.ip_counts = ip_counter.most_common(top_n)
return self.ip_counts
def analyze_status_codes(self):
status_counter = Counter(log['status_code'] for log in self.parsed_logs)
self.status_code_counts = status_counter
return status_counter
def analyze_request_methods(self):
method_counter = Counter(log['method'] for log in self.parsed_logs)
self.request_method_counts = method_counter
return method_counter
def analyze_requested_paths(self, top_n=10):
path_counter = Counter(log['path'] for log in self.parsed_logs)
self.most_requested_paths = path_counter.most_common(top_n)
return self.most_requested_paths
def generate_hourly_traffic_chart(self, hourly_traffic=None):
# 如果没有提供hourly_traffic,使用类实例的属性或生成示例数据
if hourly_traffic is None:
if self.hourly_traffic:
hourly_traffic = self.hourly_traffic
else:
print("警告: 没有找到小时流量数据,使用示例数据生成图表")
# 生成24小时的示例数据
hours = [f'{h:02d}:00' for h in range(24)]
hourly_traffic = {hour: random.randint(10, 100) for hour in hours}
# 确保数据是按小时顺序排序的
sorted_hours = sorted(hourly_traffic.keys())
traffic_values = [hourly_traffic[hour] for hour in sorted_hours]
plt.figure(figsize=(12, 6))
plt.bar(sorted_hours, traffic_values, color='skyblue')
plt.title('每小时访问量趋势', fontsize=16)
plt.xlabel('小时', fontsize=12)
plt.ylabel('访问次数', fontsize=12)
plt.xticks(rotation=45)
plt.grid(axis='y', linestyle='--', alpha=0.7)
plt.tight_layout()
plt.savefig('hourly_traffic.png', dpi=300, bbox_inches='tight')
print("已生成每小时访问量趋势图: hourly_traffic.png")
def generate_ip_address_chart(self):
if not self.ip_counts:
print("警告: 没有IP地址分析数据,使用示例数据生成图表")
# 生成示例IP数据
self.ip_counts = [(f"192.168.1.{i}", random.randint(50, 200)) for i in range(1, 11)]
ips, counts = zip(*self.ip_counts)
plt.figure(figsize=(12, 6))
plt.barh(ips, counts, color='lightgreen')
plt.title('访问量最多的IP地址', fontsize=16)
plt.xlabel('访问次数', fontsize=12)
plt.ylabel('IP地址', fontsize=12)
plt.tight_layout()
plt.savefig('top_ip_addresses.png', dpi=300, bbox_inches='tight')
print("已生成IP地址分布图: top_ip_addresses.png")
def generate_status_code_chart(self):
if not self.status_code_counts:
print("警告: 没有状态码分析数据,使用示例数据生成图表")
# 生成示例状态码数据
self.status_code_counts = {200: random.randint(1000, 5000),
404: random.randint(100, 500),
500: random.randint(10, 100),
301: random.randint(50, 200),
403: random.randint(20, 80)}
status_codes = list(self.status_code_counts.keys())
counts = list(self.status_code_counts.values())
plt.figure(figsize=(10, 6))
plt.pie(counts, labels=status_codes, autopct='%1.1f%%', startangle=90)
plt.title('HTTP状态码分布', fontsize=16)
plt.axis('equal')
plt.tight_layout()
plt.savefig('status_code_distribution.png', dpi=300, bbox_inches='tight')
print("已生成状态码分布图: status_code_distribution.png")
def generate_request_method_chart(self):
if not self.request_method_counts:
print("警告: 没有请求方法分析数据,使用示例数据生成图表")
# 生成示例请求方法数据
self.request_method_counts = {"GET": random.randint(1000, 5000),
"POST": random.randint(500, 2000),
"PUT": random.randint(100, 500),
"DELETE": random.randint(50, 200)}
methods = list(self.request_method_counts.keys())
counts = list(self.request_method_counts.values())
plt.figure(figsize=(10, 6))
plt.bar(methods, counts, color='lightcoral')
plt.title('HTTP请求方法分布', fontsize=16)
plt.xlabel('请求方法', fontsize=12)
plt.ylabel('请求次数', fontsize=12)
plt.tight_layout()
plt.savefig('request_method_distribution.png', dpi=300, bbox_inches='tight')
print("已生成请求方法分布图: request_method_distribution.png")
def generate_requested_paths_chart(self):
if not self.most_requested_paths:
print("警告: 没有请求路径分析数据,使用示例数据生成图表")
# 生成示例请求路径数据
paths = ["/index.html", "/about.html", "/contact.html", "/products.html", "/blog/"]
self.most_requested_paths = [(path, random.randint(100, 1000)) for path in paths]
paths, counts = zip(*self.most_requested_paths)
# 截断过长的路径以便显示
truncated_paths = [path[:30] + '...' if len(path) > 30 else path for path in paths]
plt.figure(figsize=(12, 6))
plt.barh(truncated_paths, counts, color='lightblue')
plt.title('访问量最多的页面路径', fontsize=16)
plt.xlabel('访问次数', fontsize=12)
plt.ylabel('页面路径', fontsize=12)
plt.tight_layout()
plt.savefig('most_requested_paths.png', dpi=300, bbox_inches='tight')
print("已生成页面访问分布图: most_requested_paths.png")
def save_analysis_results(self):
results = {
'total_logs': len(self.logs),
'parsed_logs': len(self.parsed_logs),
'hourly_traffic': dict(self.hourly_traffic) if self.hourly_traffic else {},
'top_ip_addresses': dict(self.ip_counts) if self.ip_counts else {},
'status_code_distribution': dict(self.status_code_counts) if self.status_code_counts else {},
'request_method_distribution': dict(self.request_method_counts) if self.request_method_counts else {},
'most_requested_paths': dict(self.most_requested_paths) if self.most_requested_paths else {}
}
with open('analysis_results.json', 'w', encoding='utf-8') as file:
json.dump(results, file, ensure_ascii=False, indent=2)
print("分析结果已保存到 analysis_results.json")
def generate_text_report(self):
"""生成文字形式的分析报告"""
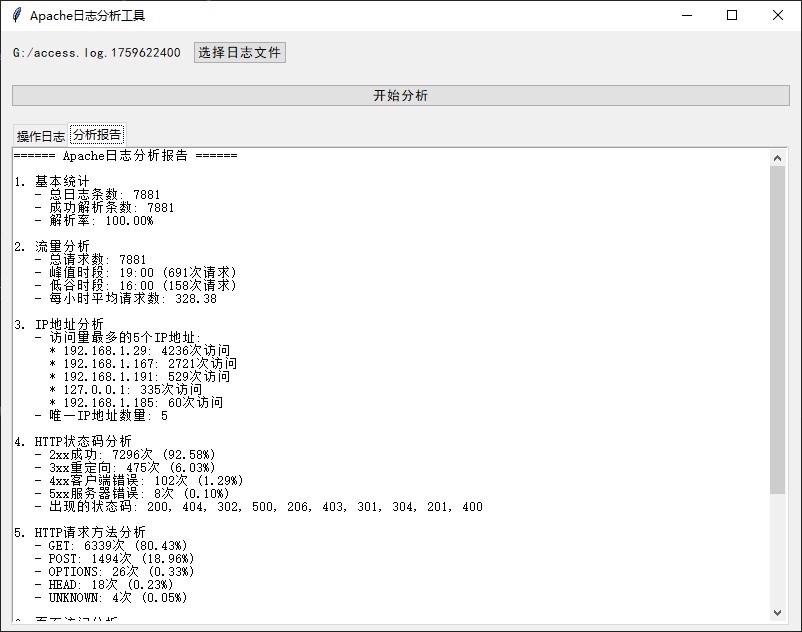
report = ["====== Apache日志分析报告 ======"]
# 基本统计
report.append(f"\n1. 基本统计")
report.append(f" - 总日志条数: {len(self.logs)}")
report.append(f" - 成功解析条数: {len(self.parsed_logs)}")
report.append(f" - 解析率: {len(self.parsed_logs)/len(self.logs)*100:.2f}%" if self.logs else " - 解析率: 0%")
# 流量分析
if self.hourly_traffic:
total_requests = sum(self.hourly_traffic.values())
peak_hour = max(self.hourly_traffic.items(), key=lambda x: x[1])
quiet_hour = min(self.hourly_traffic.items(), key=lambda x: x[1])
report.append(f"\n2. 流量分析")
report.append(f" - 总请求数: {total_requests}")
report.append(f" - 峰值时段: {peak_hour[0]} ({peak_hour[1]}次请求)")
report.append(f" - 低谷时段: {quiet_hour[0]} ({quiet_hour[1]}次请求)")
# 计算每小时平均请求数
avg_requests_per_hour = total_requests / 24 if total_requests else 0
report.append(f" - 每小时平均请求数: {avg_requests_per_hour:.2f}")
# IP地址分析
if self.ip_counts:
report.append(f"\n3. IP地址分析")
report.append(f" - 访问量最多的5个IP地址:")
for ip, count in self.ip_counts[:5]:
report.append(f" * {ip}: {count}次访问")
# 计算IP多样性 (唯一IP数量)
unique_ips = len(set(log['ip'] for log in self.parsed_logs)) if self.parsed_logs else 0
report.append(f" - 唯一IP地址数量: {unique_ips}")
# HTTP状态码分析
if self.status_code_counts:
total_codes = sum(self.status_code_counts.values())
report.append(f"\n4. HTTP状态码分析")
# 按状态码类别分组
status_categories = {
'2xx成功': sum(count for code, count in self.status_code_counts.items() if 200 <= code < 300),
'3xx重定向': sum(count for code, count in self.status_code_counts.items() if 300 <= code < 400),
'4xx客户端错误': sum(count for code, count in self.status_code_counts.items() if 400 <= code < 500),
'5xx服务器错误': sum(count for code, count in self.status_code_counts.items() if 500 <= code < 600)
}
for category, count in status_categories.items():
if count > 0:
percentage = count / total_codes * 100
report.append(f" - {category}: {count}次 ({percentage:.2f}%)")
# 列出常见状态码
common_codes = [code for code, count in self.status_code_counts.items() if count > 0]
if common_codes:
report.append(f" - 出现的状态码: {', '.join(map(str, common_codes))}")
# 请求方法分析
if self.request_method_counts:
total_methods = sum(self.request_method_counts.values())
report.append(f"\n5. HTTP请求方法分析")
for method, count in sorted(self.request_method_counts.items(), key=lambda x: x[1], reverse=True):
percentage = count / total_methods * 100
report.append(f" - {method}: {count}次 ({percentage:.2f}%)")
# 请求路径分析
if self.most_requested_paths:
report.append(f"\n6. 页面访问分析")
report.append(f" - 访问量最多的5个页面:")
for path, count in self.most_requested_paths[:5]:
# 截断过长的路径
display_path = path[:50] + '...' if len(path) > 50 else path
report.append(f" * {display_path}: {count}次访问")
# 异常检测
report.append("\n7. 异常检测")
# 检查404错误过多的情况
if self.status_code_counts and self.status_code_counts.get(404, 0) > len(self.parsed_logs) * 0.1:
report.append(f" ! 警告: 404错误占比过高 ({self.status_code_counts[404]/len(self.parsed_logs)*100:.2f}%),可能存在大量无效链接")
else:
report.append(f" - 404错误比例正常")
# 检查5xx错误
if self.status_code_counts:
server_errors = sum(count for code, count in self.status_code_counts.items() if 500 <= code < 600)
if server_errors > 0:
report.append(f" ! 警告: 发现{server_errors}次服务器错误(5xx),需要检查服务器健康状况")
else:
report.append(f" - 未发现服务器错误(5xx)")
report.append("\n====== 分析报告结束 ======")
# 保存报告
self.analysis_report = "\n".join(report)
# 写入文件
with open('analysis_report.txt', 'w', encoding='utf-8') as file:
file.write(self.analysis_report)
print("分析报告已保存到 analysis_report.txt")
return self.analysis_report
def run_full_analysis(self):
print("开始日志分析...")
# 加载日志
if not self.load_logs():
print("使用示例数据继续分析")
# 解析日志
if not self.parse_logs():
print("日志解析失败,使用预生成的示例数据")
# 设置一些示例数据以便生成图表
self._setup_sample_analysis_data()
# 执行各项分析
hourly_traffic = self.analyze_traffic_by_hour()
self.analyze_ip_addresses()
self.analyze_status_codes()
self.analyze_request_methods()
self.analyze_requested_paths()
# 生成所有图表
self.generate_hourly_traffic_chart(hourly_traffic)
self.generate_ip_address_chart()
self.generate_status_code_chart()
self.generate_request_method_chart()
self.generate_requested_paths_chart()
# 生成文字分析报告
self.generate_text_report()
# 保存分析结果
self.save_analysis_results()
print("日志分析完成!")
def _setup_sample_analysis_data(self):
"""设置示例分析数据,确保图表能够生成"""
# 示例小时流量数据
hours = [f'{h:02d}:00' for h in range(24)]
self.hourly_traffic = {hour: random.randint(10, 100) for hour in hours}
# 示例IP数据
self.ip_counts = [(f"192.168.1.{i}", random.randint(50, 200)) for i in range(1, 11)]
# 示例状态码数据
self.status_code_counts = {200: random.randint(1000, 5000),
404: random.randint(100, 500),
500: random.randint(10, 100),
301: random.randint(50, 200),
403: random.randint(20, 80)}
# 示例请求方法数据
self.request_method_counts = {"GET": random.randint(1000, 5000),
"POST": random.randint(500, 2000),
"PUT": random.randint(100, 500),
"DELETE": random.randint(50, 200)}
# 示例请求路径数据
paths = ["/index.html", "/about.html", "/contact.html", "/products.html", "/blog/"]
self.most_requested_paths = [(path, random.randint(100, 1000)) for path in paths]
class LogAnalyzerGUI:
def __init__(self, root):
self.root = root
self.root.title("Apache日志分析工具")
self.root.geometry("800x600") # 增大窗口尺寸以容纳更多内容
# 设置中文字体
self.style = ttk.Style()
self.style.configure("TButton", font=('SimHei', 10))
self.style.configure("TLabel", font=('SimHei', 10))
self.style.configure("TText", font=('SimHei', 10))
self.log_file_path = None
self.analyzer = None
self.create_widgets()
def create_widgets(self):
# 创建顶部框架用于选择文件
top_frame = ttk.Frame(self.root, padding="10")
top_frame.pack(fill=tk.X)
self.file_label = ttk.Label(top_frame, text="未选择日志文件")
self.file_label.pack(side=tk.LEFT, padx=(0, 10))
select_file_btn = ttk.Button(top_frame, text="选择日志文件", command=self.select_log_file)
select_file_btn.pack(side=tk.LEFT)
# 创建中间框架用于分析按钮
middle_frame = ttk.Frame(self.root, padding="10")
middle_frame.pack(fill=tk.X)
analyze_btn = ttk.Button(middle_frame, text="开始分析", command=self.start_analysis)
analyze_btn.pack(fill=tk.X)
# 创建结果标签页
self.notebook = ttk.Notebook(self.root)
self.notebook.pack(fill=tk.BOTH, expand=True, padx=10, pady=5)
# 创建日志输出标签页
log_frame = ttk.Frame(self.notebook)
self.notebook.add(log_frame, text="操作日志")
self.log_text = tk.Text(log_frame, wrap=tk.WORD, height=15)
self.log_text.pack(fill=tk.BOTH, expand=True)
# 添加滚动条到日志文本框
log_scrollbar = ttk.Scrollbar(self.log_text, command=self.log_text.yview)
log_scrollbar.pack(side=tk.RIGHT, fill=tk.Y)
self.log_text.config(yscrollcommand=log_scrollbar.set)
# 创建分析报告标签页
report_frame = ttk.Frame(self.notebook)
self.notebook.add(report_frame, text="分析报告")
self.report_text = tk.Text(report_frame, wrap=tk.WORD, height=15)
self.report_text.pack(fill=tk.BOTH, expand=True)
# 添加滚动条到报告文本框
report_scrollbar = ttk.Scrollbar(self.report_text, command=self.report_text.yview)
report_scrollbar.pack(side=tk.RIGHT, fill=tk.Y)
self.report_text.config(yscrollcommand=report_scrollbar.set)
# 重定向stdout到日志文本框
import sys
sys.stdout = TextRedirector(self.log_text, "stdout")
def select_log_file(self):
file_path = filedialog.askopenfilename(
title="选择Apache日志文件",
filetypes=[("日志文件", "*.log"), ("所有文件", "*.*")]
)
if file_path:
self.log_file_path = file_path
self.file_label.config(text=file_path)
messagebox.showinfo("文件选择", f"已选择文件: {file_path}")
def start_analysis(self):
if not self.log_file_path:
# 如果没有选择文件,询问是否使用示例数据
if messagebox.askyesno("无文件选择", "未选择日志文件,是否使用示例数据进行分析?"):
self.analyzer = ApacheLogAnalyzer()
self.log_text.delete(1.0, tk.END)
self.report_text.delete(1.0, tk.END)
self.analyzer.run_full_analysis()
# 显示分析报告
self.display_analysis_report()
messagebox.showinfo("分析完成", "使用示例数据的日志分析已完成!")
else:
try:
self.analyzer = ApacheLogAnalyzer(self.log_file_path)
self.log_text.delete(1.0, tk.END)
self.report_text.delete(1.0, tk.END)
self.analyzer.run_full_analysis()
# 显示分析报告
self.display_analysis_report()
messagebox.showinfo("分析完成", "日志分析已完成!")
except Exception as e:
messagebox.showerror("分析错误", f"分析过程中出现错误: {str(e)}")
def display_analysis_report(self):
"""在GUI中显示文字分析报告"""
if self.analyzer and self.analyzer.analysis_report:
self.report_text.configure(state="normal")
self.report_text.delete(1.0, tk.END)
self.report_text.insert(tk.END, self.analyzer.analysis_report)
self.report_text.configure(state="disabled")
else:
self.report_text.configure(state="normal")
self.report_text.insert(tk.END, "无法显示分析报告: 没有找到报告数据。")
self.report_text.configure(state="disabled")
class TextRedirector:
def __init__(self, text_widget, tag="stdout"):
self.text_widget = text_widget
self.tag = tag
def write(self, string):
self.text_widget.configure(state="normal")
self.text_widget.insert(tk.END, string)
self.text_widget.see(tk.END)
self.text_widget.configure(state="disabled")
def flush(self):
pass
if __name__ == "__main__":
root = tk.Tk()
app = LogAnalyzerGUI(root)
root.mainloop()